Abstract
When doctors cannot explain a child's symptoms, the answer is often written in the child's DNA. The trouble is that DNA is enormous, and nobody can read it by eye. Rare disease genomics gets around that by turning sequencing into data that software and specialists can search and interpret together. This article shows how DNA data helps identify genetic disorders. It also covers what the evidence says and where the limits are.
What Is Hiding Inside DNA Data
1. A very long text with a few meaningful typos
A human genome has about 3 billion letters, and every person differs from the reference in several million places. Nearly all of those differences are harmless. Rare disease genomics hunts for the handful that are not.
2. Why rare conditions are hard to spot
There are more than 7,000 known rare diseases. Each one is uncommon, so a doctor may meet a given condition only once in a career. Symptoms can also look like common problems, which is why the genome often gets read only after years of other tests. Our piece on families living with rare conditions describes that experience from the inside.
From Sample to Finding
1. The workflow
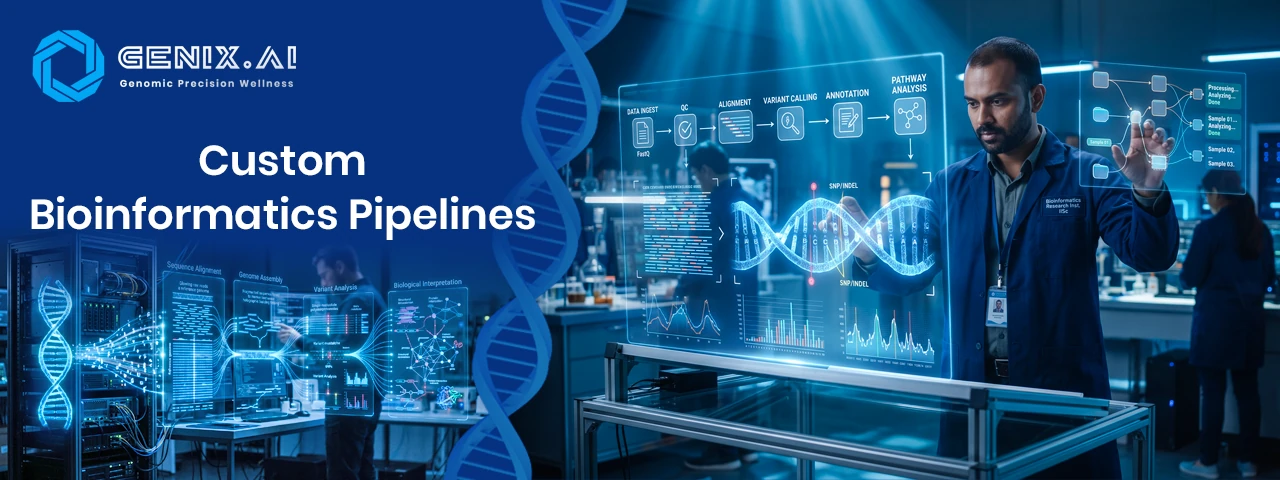
Saliva or blood sample → DNA extraction → Sequencing → Alignment to reference → Variant calling → Annotation → Prioritisation → Specialist review → Report2. Genomic data analysis in plain words
After the machine finishes, software compares every read with the reference genome and lists each difference. That list is then trimmed hard. Variants that are common in healthy people are set aside, and what remains is checked against what is known about genes and symptoms. Finally each candidate is graded, from clearly harmful through uncertain to harmless. For the technical side, our guide to DNA sequencing data analysis goes step by step.
3. Why family data helps
Sequencing a child together with both parents shows which changes were inherited and which appeared for the first time. That single detail can shrink a long suspect list very quickly.
What the Evidence Shows
1. A national test of genome sequencing
In the NHS 100,000 Genomes Project, researchers studied 4,660 participants from 2,183 families with suspected rare disease. Whole genome sequencing led to a diagnosis for 25 percent of them, and the rate reached 35 percent when a single gene was suspected. Roughly 14 percent of diagnoses would not have been made with other genetic tests.
2. The three quarters still waiting
That leaves most families without an answer for now. The words "for now" matter, because genome data can be analysed again as knowledge grows. The project's leaders have launched a fresh reanalysis of all their rare disease participants.
A Family Story
One family described in the study had kidney disease across three generations. A man in his 60s had already had two kidney transplants, and his father, brother and uncle had all died from kidney disease. Coverage of the study also described a grandfather and his daughter who shared a genetic diagnosis, which opened the door to testing his 15 year old granddaughter. A diagnosis rarely belongs to one person alone. Finding the cause in one relative can give the rest of the family clear next steps.
Screening Is Not the Same as Diagnosing
Know what your report is
Many consumer tests screen for known variants in selected genes. That can be a useful starting point, but a screening report only points to findings worth discussing. A clinician decides what they mean alongside symptoms and family history. Couples planning a family may also want to read about carrier screening, which is a related but separate question.
Conclusion
DNA data does not hand over answers by itself. It works when sequencing, careful analysis and expert judgement come together, and when everyone is honest about what a result can and cannot say. Genix.ai builds around that idea. Its genomic intelligence platform takes sequencing files through secure intake, bioinformatics processing and AI led prioritisation, then expert validation before a report is delivered. The platform describes phenotype and population signals as part of that workflow. People who already hold sequencing data can turn to the NGS data analysis service, where WGS and WES variant analysis includes ACMG classification and 30x WGS is listed at $400 per sample with a 5 to 7 day turnaround. For a starting point without existing data, its genetic disorder screening panel covers more than 750 disorders and is listed at ₹24,999 at the time of writing. That page states plainly that the report supports awareness and is not a medical diagnosis, so take any result to your doctor.
FAQs
1. How does DNA data help identify genetic disorders?
Software compares a person's sequence with a reference and flags changes that fit known disease genes and symptoms.
2. What is the difference between exome and genome sequencing for genetic disorder diagnosis?
Exome sequencing reads the protein coding parts of DNA while whole genome sequencing reads nearly all of it.
3. Why do some people still get no answer?
Some causes are not yet understood, which is why sequencing data can be analysed again later.
4. Does a screening report count as a diagnosis?
No, it points to findings that a clinician must interpret.
5. Why are parents sometimes sequenced as well?
It shows which changes were inherited and which are new.